A unified spatial & molecular atlas of anatomically restricted large B-cell lymphomas
Large B-cell lymphomas (LBCLs) are biologically and clinically heterogeneous, yet certain extranodal variants show stereotyped molecular and immune profiles linked to their anatomical origins. Tumors in immune-privileged sites—primary CNS (PCNSL) and -testicular LBCL (PTL)—frequently carry NF-κB lesions and activated B-cell phenotypes associated with poor outcomes, whereas primary bone LBCL (PBL) exhibits germinal-center features with immune-modulatory mutations and more favorable prognosis. These patterns suggest that anatomical origin defines a meaningful biological axis for LBCL classification. We therefore established a Unified Spatial and Molecular Atlas integrating genomic, transcriptomic, spatial proteomic, and clinical data to evaluate classifiers and identify site-specific vulnerabilities.
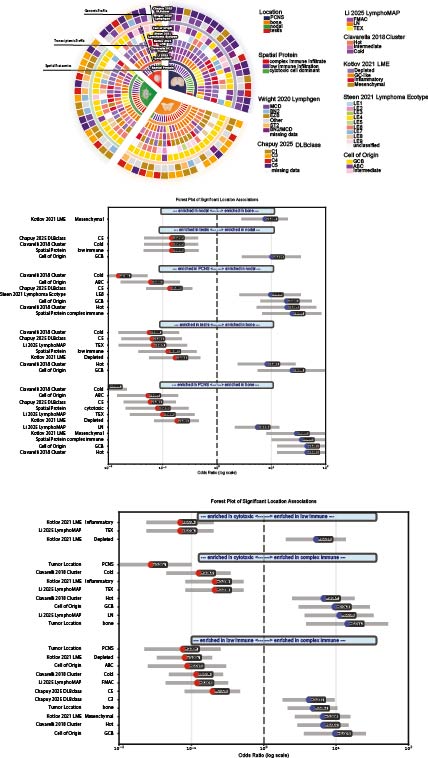
Archival diagnostic FFPE biopsies from 68 well-annotated LBCLs at Leiden University Medical Center were analyzed: 22 PCNSL, 9 PTL, 21 PBL, and 18 localized nodal LBCLs. DNA, RNA, and spatial proteomics were derived from the same blocks. Genomic profiling (111-gene amplicon panel); transcriptomes profiling (800-gene nCounter panel). Spatial proteomics with imaging mass cytometry (41-antibody panel). Our computational pipeline, Unhuddle, enabled refined single-cell quantification and case-level clustering using absolute cell densities (cells/mm²). Classification incorporated established algorithms based on tumor genotype (LymphGen and DLBclass) and transcriptomic microenvironment deconvolution (LymphoMAP, Ciavarella 2018, Kotlov 2021).
Three stereotyped spatial immune ecosystems emerged across anatomical subtypes: Cytotoxic Predominant, Complex Immune, and Immune Depleted. Nodal DLBCL and PBL were enriched for the Complex Immune ecosystem, absent from PCNSL and PTL (OR = 52, p < 0.001). PCNSL was enriched for Cytotoxic Predominant (OR = 6, p = 0.01), while Immune Depleted showed no site specificity. Each ecosystem aligned with distinct genomic and transcriptomic signatures. Complex Immune tumors showed favorable survival and enrichment for LN-type LymphoMAP (OR = 3, p = 0.02), “Hot” Ciavarella cluster (OR = 7, p < 0.001), Mesenchymal LME (OR = 10, p < 0.001), and DLBclass C3 (OR = 4, p < 0.01). Cytotoxic Predominant tumors were enriched for TEX LymphoMAP (OR = 8, p < 0.01), Inflammatory LME (OR = 8, p < 0.01), and DLBclass C4 (OR = 4, p < 0.05). Immune Depleted tumors corresponded to FMAC LymphoMAP (OR = 5, p = 0.01), “Cold” Ciavarella cluster (OR = 4, p = 0.01), Depleted LME (OR = 9, p < 0.001), and DLBclass C5 (OR = 4, p = 0.02). C5 classification associated more strongly with anatomical site than with spatial ecosystem.
This atlas links tumor genomics, transcriptomics, and spatial immune architecture in LBCL. PTL and PCNSL display immune exclusion or cytotoxic exhaustion consistent with inferior survival, whereas Complex Immune ecosystems—predominant in bone and nodal LBCL—confer benefit. Genomic profiles correlate more with anatomical site than with immune ecosystem, suggesting immune contexture can modulate genomic risk.